
Open buildings data in China - how good is it? Testing on our benchmark

The most significant open buildings dataset in 2025 (and possibly ever) was released on December 1 by a research group from the Technical University of Munich (TUM) --- "GlobalBuildingAtlas".
What's great about this dataset is that it outperforms all others in the number of buildings (2.75 billion) and, in our estimation, also outperforms them in data quality.
Of course, the authors confidently state that their work is the best, supported by quantitative metrics. However, metrics alone rarely engage users unless they can visually inspect the data in the context of their own use cases. Like we did.
The claims about this work, which make it outstanding:
- The overall number of buildings and global coverage
- A novel fusion strategy to merge building polygons based on existing open data, including OpenStreetMap, and combine them with newly generated polygons
- The original image resolution of Planetscope imagery, which is claimed to be used as input data, is 3m only GSD -- surprisingly low resolution data for such a detailed output
- The reported accuracy, given all the details above
Our motivation
Given that we had already been working on our own validation samples to improve the Mapflow "Buildings" model, we chose China --- probably the most challenging region for country-scale building-height estimation --- as a benchmark to test GlobalBuildingAtlas (GAB).
In particular, we were interested in whether this new open dataset demonstrates superior quality compared to "3D-GloBFP", a dataset released in 2024 that also contains building heights. (We've come across the post on the last one tested over the territory in São Paulo, where it showed quite poor results. That said, 3D-GloBFP was expected to perform better in China, given its explicit focus on this geographic domain.)
Ground truth takes it all
Below are a few notes on how we curated our validation data.
Press enter or click to view image in full size
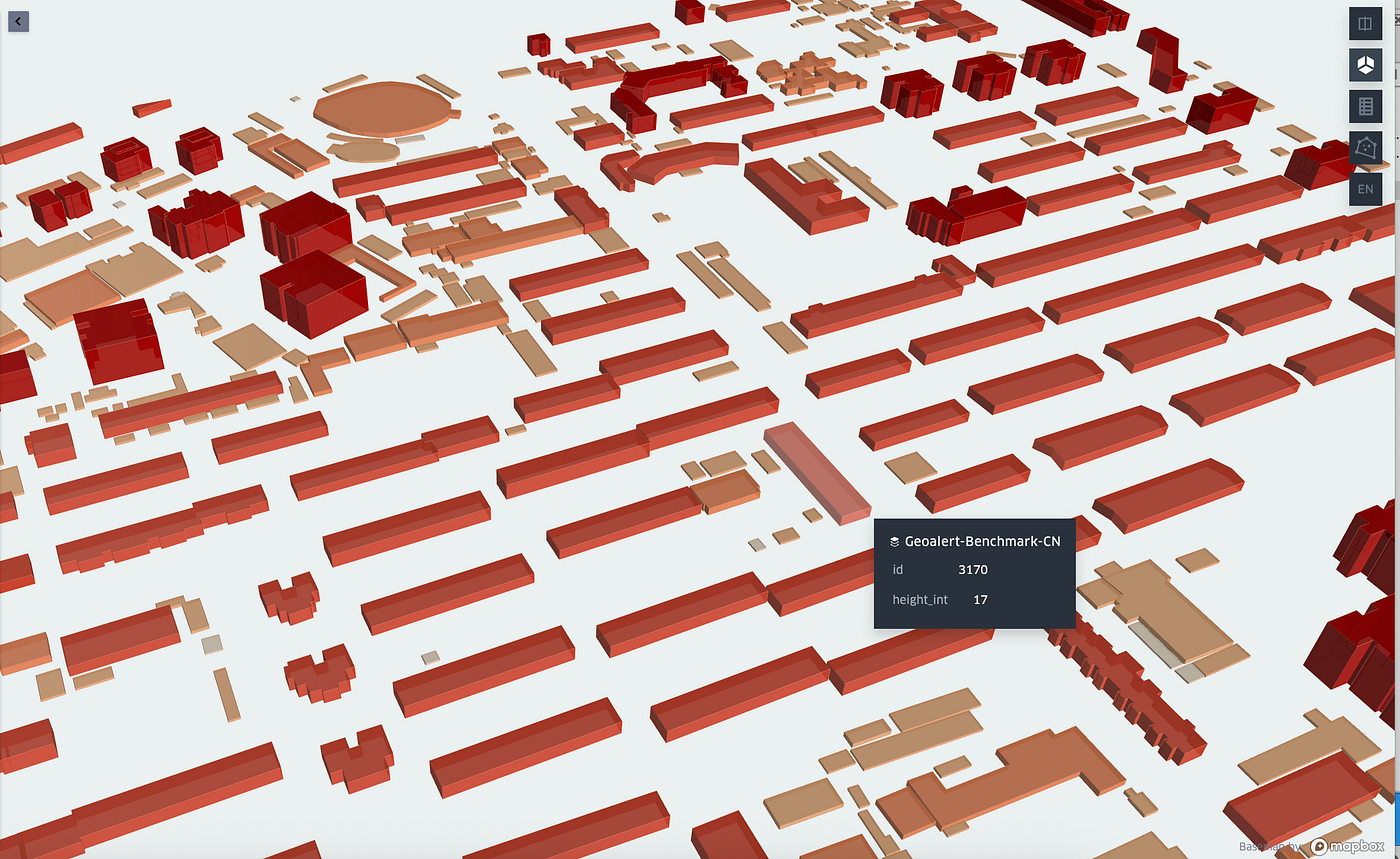
"Groud truth" buildings visualised with Kepler gl
Due to the lack of LiDAR-based or otherwise trusted reference data for building heights in China, we adopted a manual pseudo-labeling workflow. We generated rooftops using the Mapflow Buildings model, then designed a GIS tool to derive building footprints based on satellite image metadata (viewing angles). These footprints were then verified and manually shifted to align with the visible building foundations.
This is a kind of work traditionally done by cartographers. While it is not as true data as LiDAR or high-resolution stereo imagery, it serves as a reasonable approximation of ground truth in the context of this experiment.
Press enter or click to view image in full size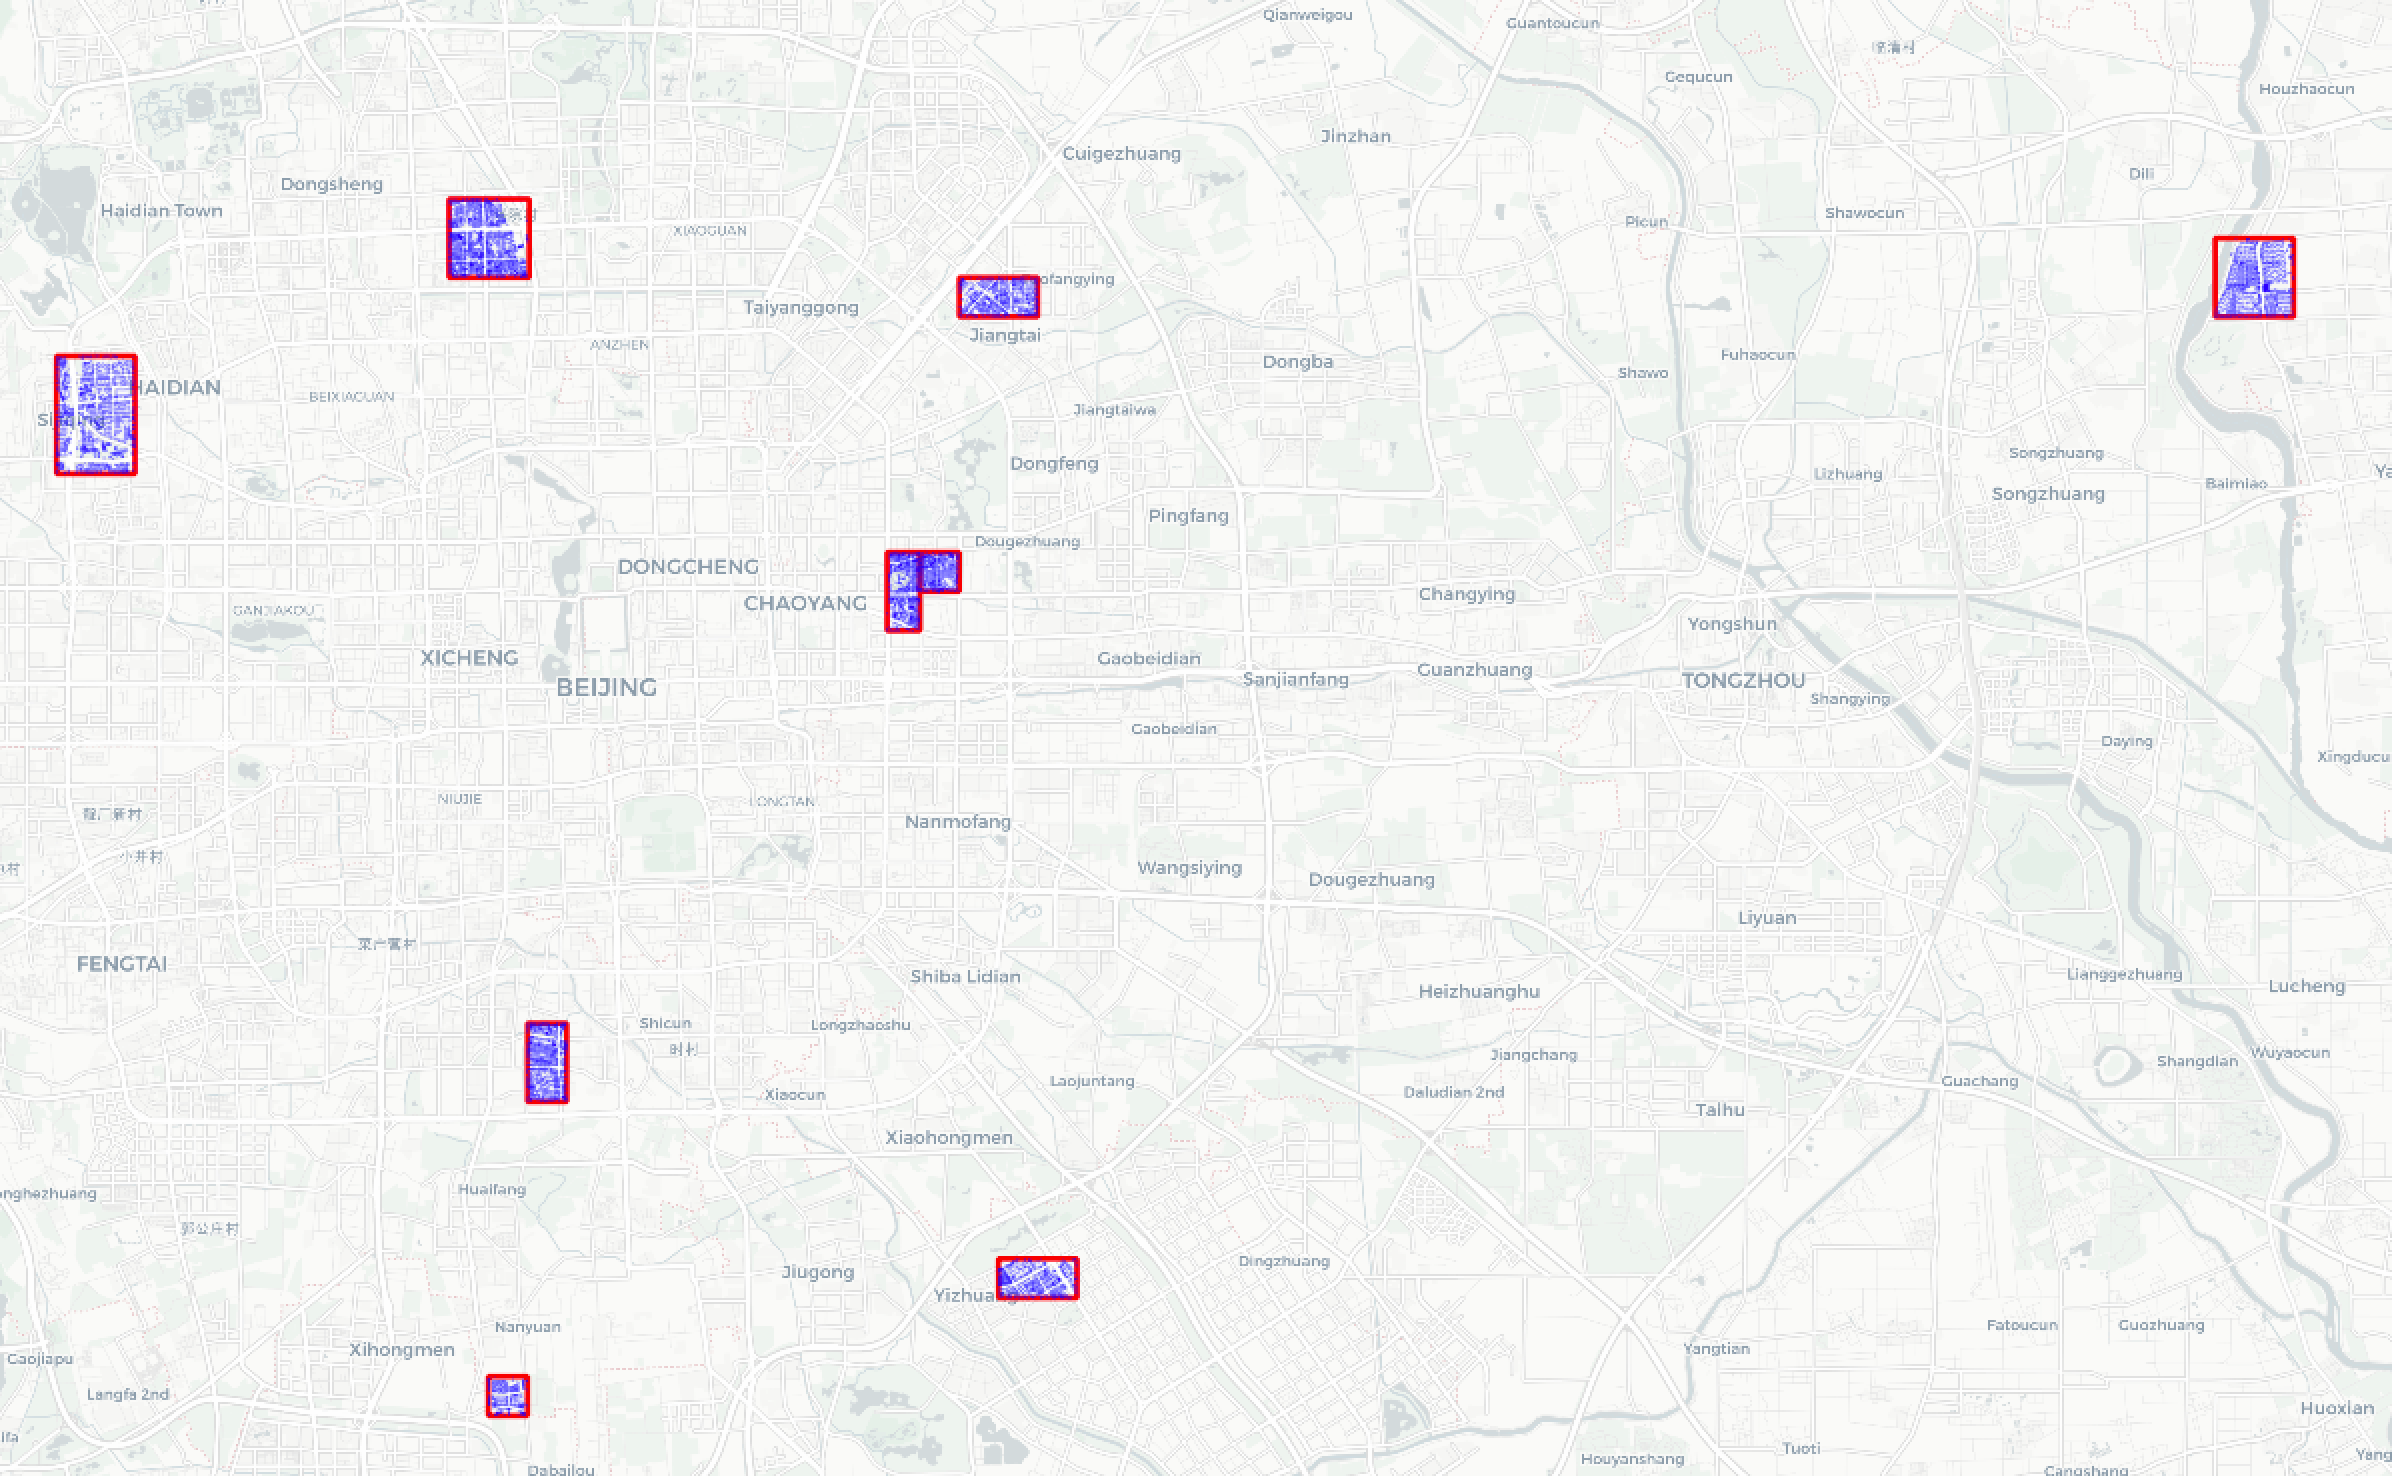
Press enter or click to view image in full size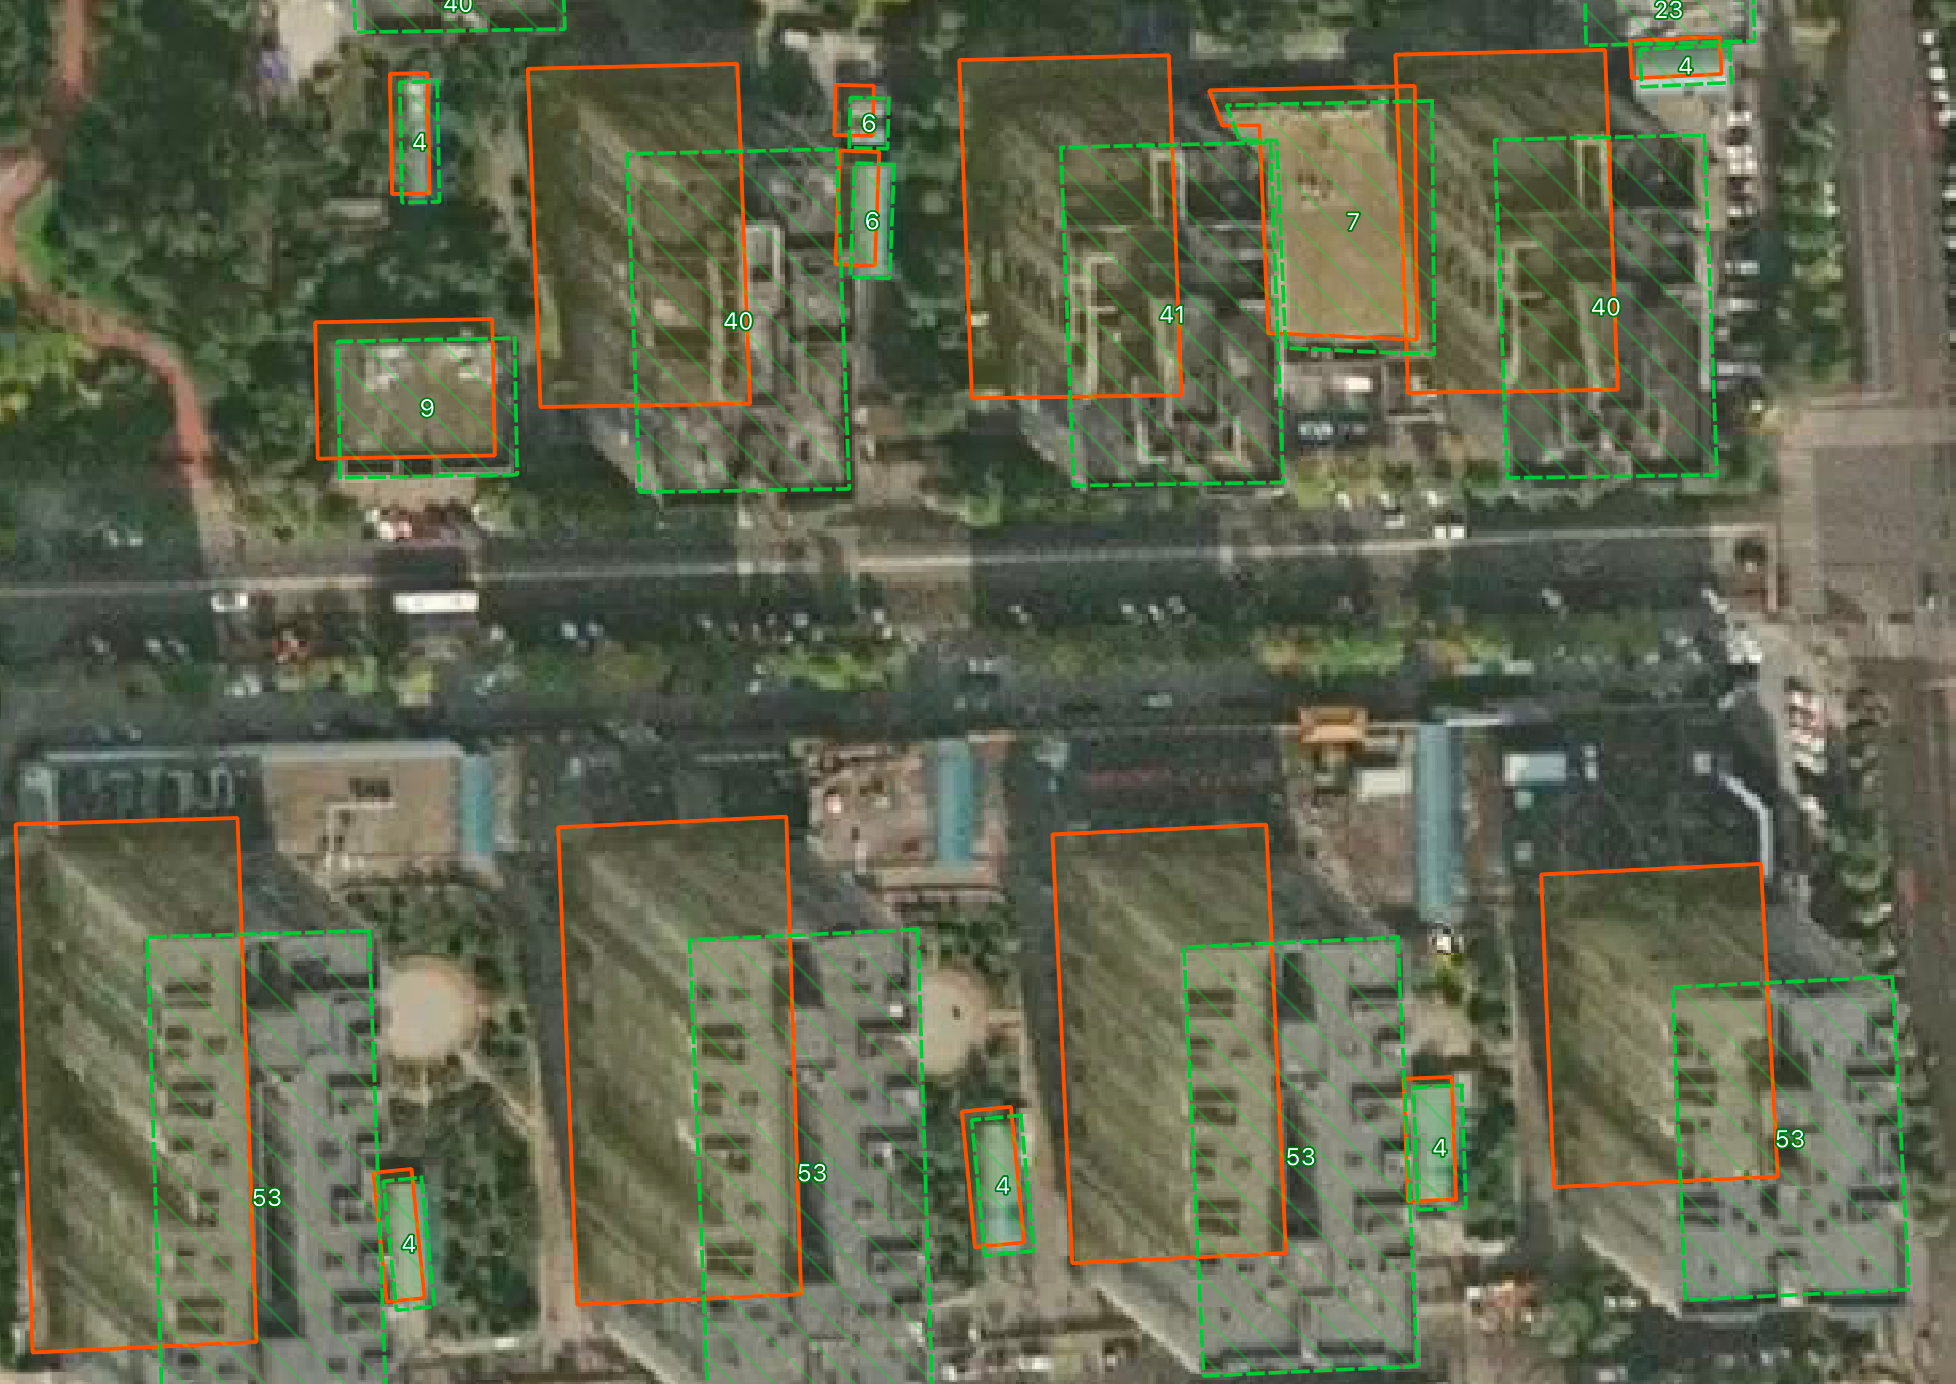
- left: 9 benchmark AOIs around Beiging 2) right: closer look at the 3D building footprints generation
In the related paper, the authors of GAB emphasized the lack of reference data (building heights) for Africa and Asia, so they refer to the data over 42 Chinese cities produced using multi-view satellite imagery. Here we come up with the three datasets available for China, which are worth comparing 😅
Testing on the benchmark 👨🔬
There is an important disclaimer --- we didn't have neither lidar data for building heights, nor satellite images of the best possible quality. So our original data is close to the reality of the current products available on the market, it wasn't enhanced artificially, and has its limitations to the visual interpretation. So we don't pretend to provide the best possible "ground truth". 🤷♂️
"42 cities"
Each of the datasets used in our review presents its own obstacles to downloading the data. In the case of "42 cities" it's nothing else, but the requirement to use Baidu disk, which requires a Chinese mobile phone number to create an account.
Press enter or click to view image in full size

Well, I've been in China, but lost my number sinse then, so I had to request a friend of mine to help me login
Here and after, we provide an example of the same area. The building contours are colored using a "height"-based gradient.
We will check the absolute numbers later, but here let's pay attention to the visual consistency of the "height" value and how the equal buildings get different heights.
Press enter or click to view image in full size
42 Chinese cities datasets (against benchmark, green contours)
Does this data look justified as a reference for GAB? Definitely not.
"3D-GloBFP"
The next one of our interest is "3D-GloBFP" --- whether it's proved to be that close to the manual labels.
Press enter or click to view image in full size
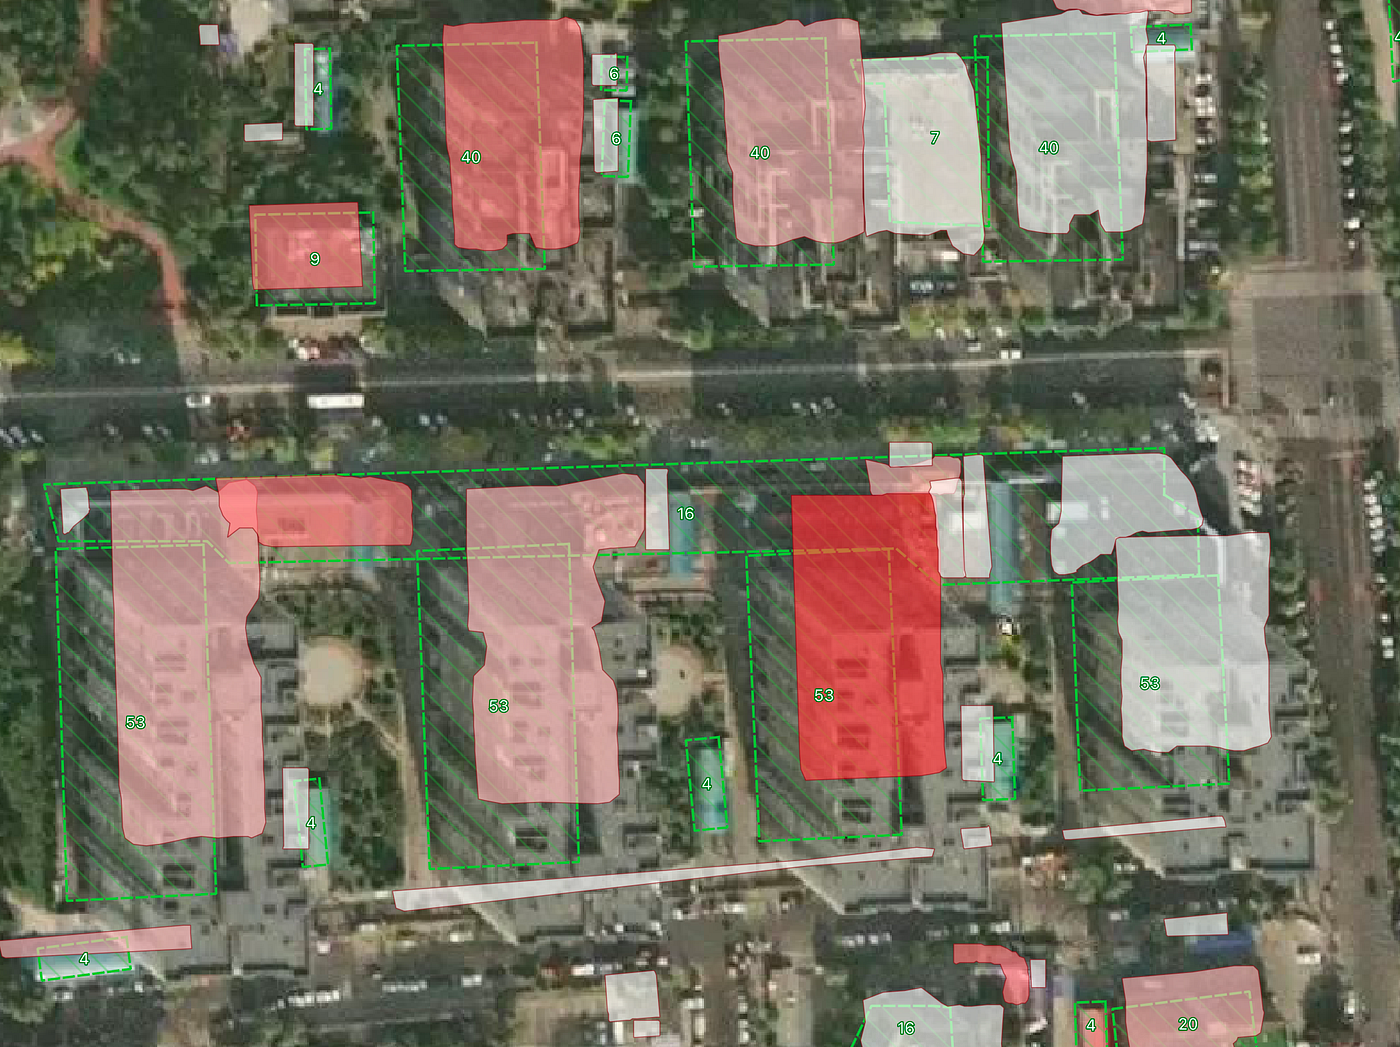
3D-GloBFP datasets (against benchmark, green contours)
The features selected by intersection with our testing areas appear more consistent. In particular, the building polygons look as if they may have been merged with manually curated governmental data (speculative).
However, there is a significant mismatch between what we see in the imagery and what the dataset provides, even though some polygons are extremely detailed.
The real difference becomes apparent when time is taken into account:
But the real difference reveals where the time factor apparently matters:
Press enter or click to view image in full size
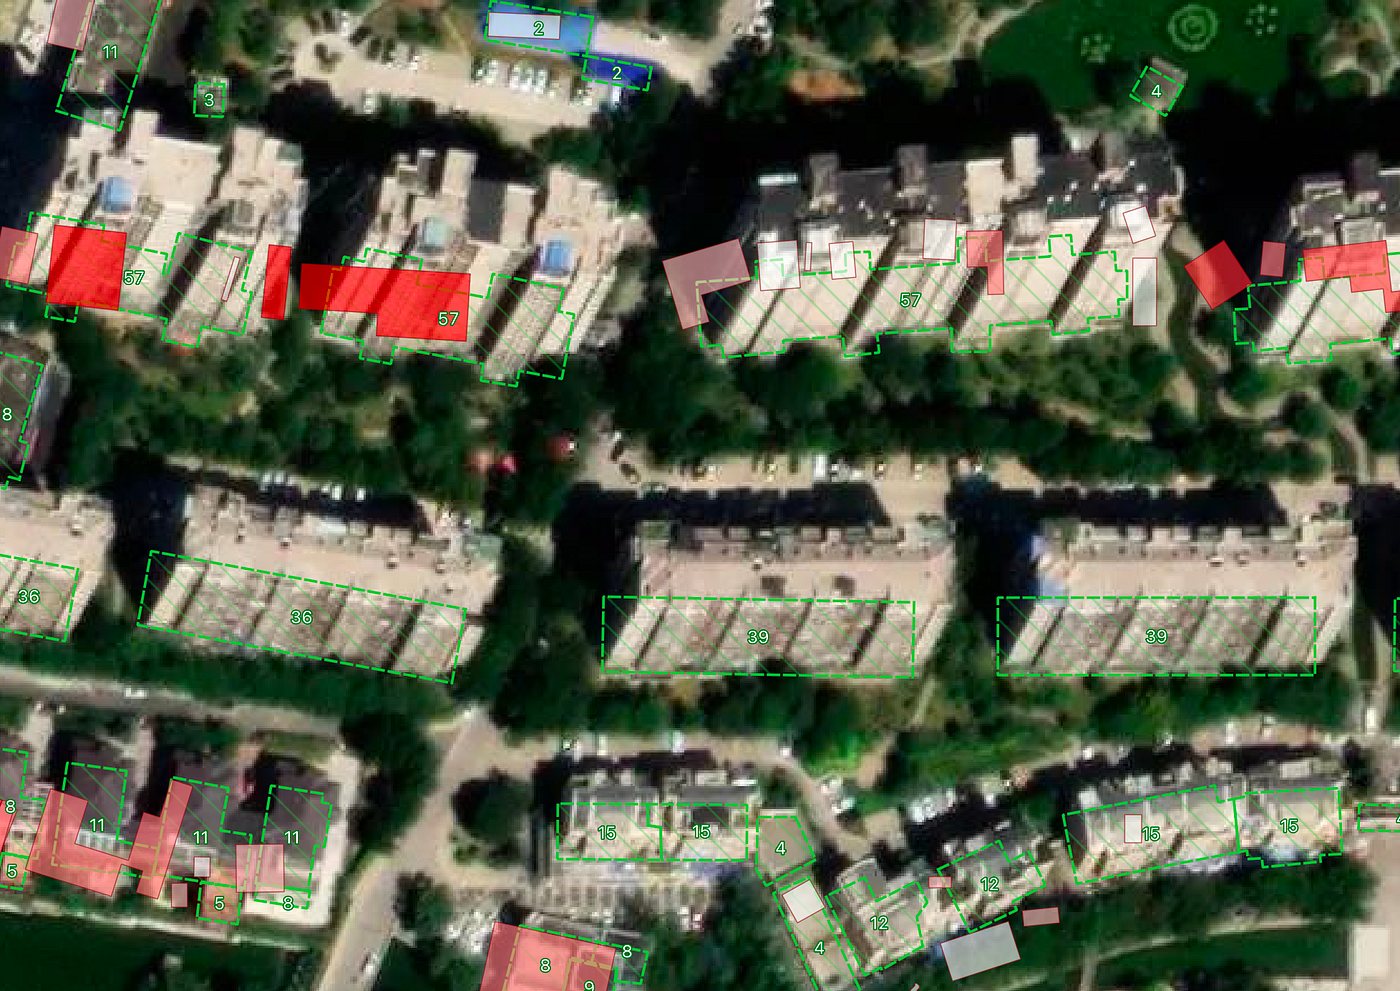
Time matters. New buildings in China grow faster than maps can be updated.
"GlobalBuildingAtlas"
Now let's preview the features extracted from the GAB dataset.
Looks like the work of the researchers paid off. By the preview, it looks much better than the analogues.
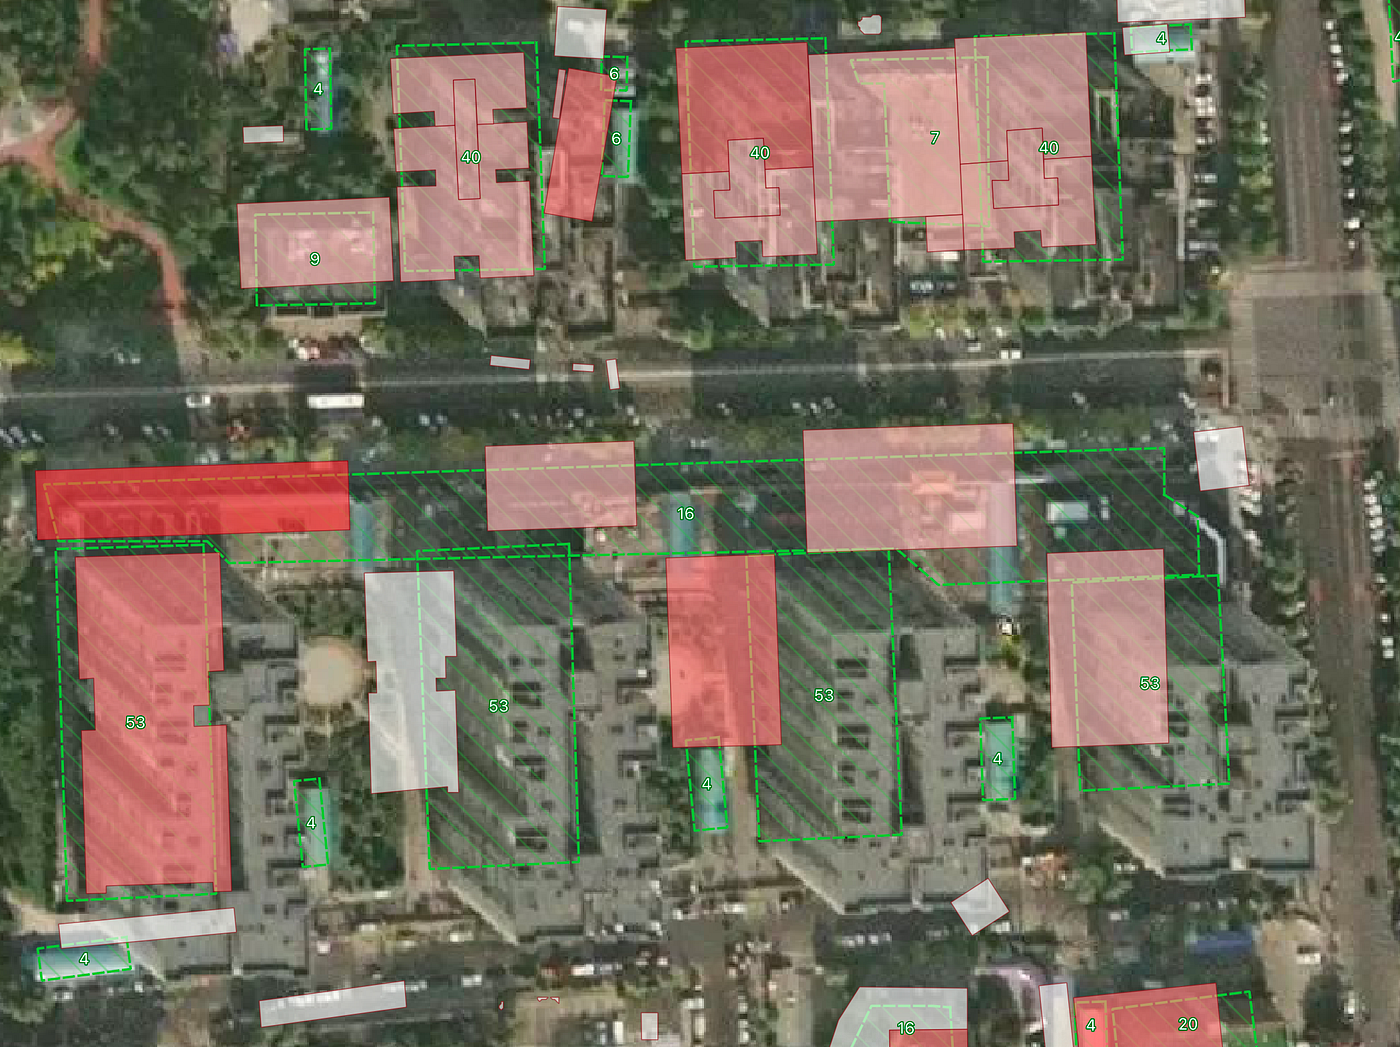
Press enter or click to view image in full size
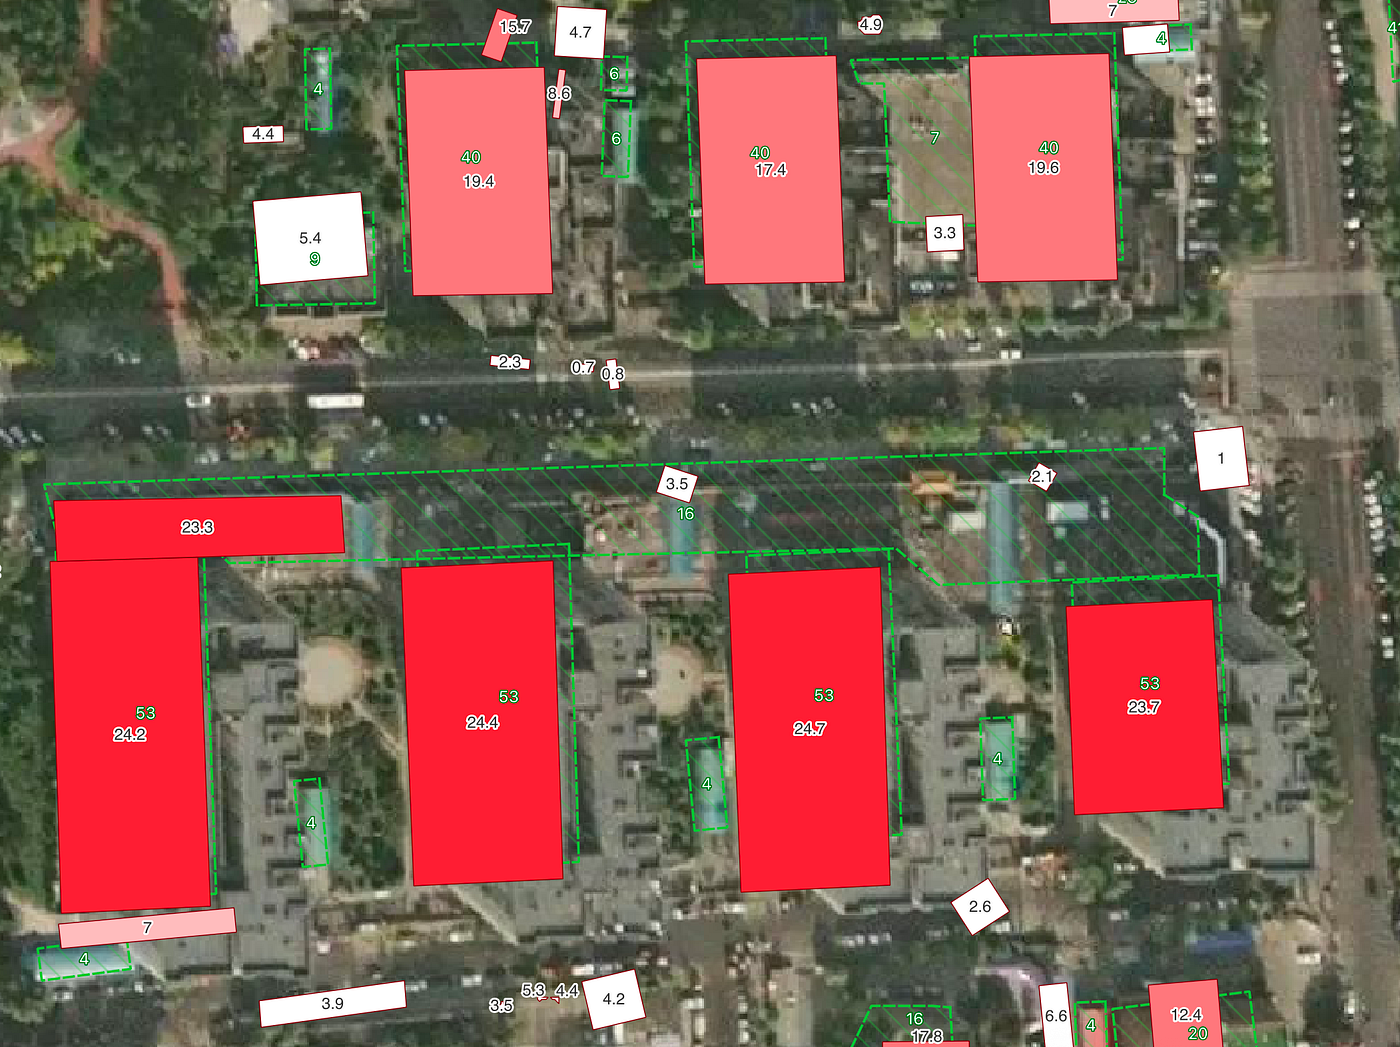
GAB datasets (against benchmark, green contours)
Looking at the absolute values, one can easily notice a systematic underestimation of building heights (a tendency explicitly acknowledged by the authors for high-rise buildings). However, the internal consistency of height values within building clusters is strong and stable.
Well done. 💪️️️️️️
Evaluation with the metrics
GBF vs benchmark
Using height as ground truth and GBF's heights as predictions, computed on 4,381 features (those that don't have an intersection with the ground truth were dropped).
Pearson correlation: 0.605 → moderate positive correlation
Accuracy / Error metrics:
MAE: 10.87 m
RMSE: 15.58 m
R²: 0.36
MAPE: 129.1%
Moderate correlation.
Very high MAPE → strong relative errors, especially for small buildings (systematic scale issues).
GAB vs benchmark
Using our manual labels as ground truth and GAB's heights as predictions, computed on 4,480 features (those that matched).
Pearson correlation: 0.784 → strong positive correlation
Accuracy / Error metrics:
MAE: 9.11 m
RMSE: 14.95 m
R²: 0.46
MAPE: 64.4%
Predictions track ground truth reasonably well (high correlation, stronger than in GFB).
MAPE is high, indicating systematic over/under-estimation.
As expected, GAB outperforms GBF by all metrics.
MAPE (Mean Absolute Percentage Error) is not good for this because small absolute errors on small buildings inflate it. It's better to use it within height intervals (e.g. <20 m, 20--50 m, 50--100 m).
For the sake of the experiment, we therefore split the data into low-rise and high-rise buildings.
GAB metrcis within two height bins (low and tall)
Conclusions (obvious part)
GlobalBuildingAtlas is the best global dataset of "building with heights".
Though it has its limitations.
Based on our China benchmark experiments, we showed that:
- Error explodes with height. MAE increases when moving from low buildings (<50 m) to taller ones (50--100 m).
- Low buildings: slight overestimation (+2 m).
- Tall buildings: strong underestimation (-34 m on average).
- RMSE shows the same pattern → large variance for tall structures
This raises an open question:
How was this level of accuracy achieved using 3 m-resolution monocular imagery, and how would performance change with higher-resolution inputs?
Appendix (comparison with Mapflow 🏠 Buildings model)
We won't be satisfied unless we test our model on the same benchmark. One may think that, as a creators of the benchmark, we might have tricked the metrics. Rather, we created the benchmark to test our model and reveal its drawbacks for further improvement. So these areas have never been used for the training of our model.
It is important to note that our model was tested on the same images used to create the benchmark, so it is expected to outperform GAB, which relied on lower-resolution imagery.
For a fair comparison we should have taken the lidar dataset from the validation areas of GAB. Likely, we'll do it in the next review, and after the upcoming update of our model to indicate the progress.
Here we provide Mapflow metrics to complete the picture and track our progress in the context of the trustworthy open datasets and continuously improving methodology.
As we have the tuned model, which requires the metadata from the satellite images (satellite and sun elevation and azimuth angles) to produce more accurate results, we took this opportunity to compare all approaches.
Ranking (best → worst)
By MAE / RMSE (absolute accuracy), and correlation / R² (scaling & variance):
- Geoalert tuned (custom)
- Geoalert default (public)
- GBA (open, 2025)
- GBF (open, 2024)
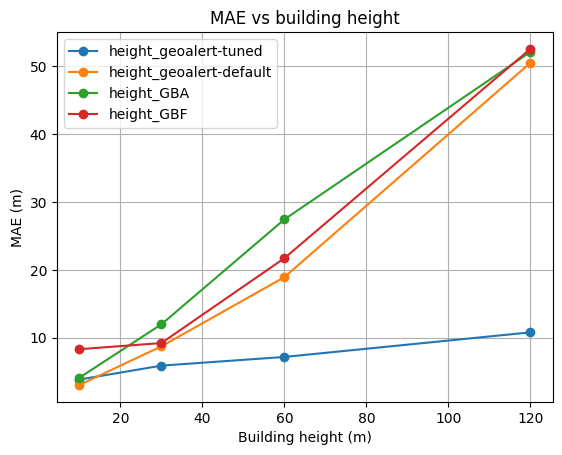
Evidently, all the models tend to increase the error towards the high-rise buildings: while Geoalert tuned (blue) grows slowly with height, Geoalert default, GBA, and GBF show rapid error growth after ~40 m.
There are a couple of additional conclusions unrelated to the main topic of this blog post:
- We have to improve our default model, as all regression-based models tend to underestimate the high-rise buildings in the heterogeneous urban environment
- Medium can't paste tables in a good-looking way 😇
In addition, we have published all the benchmarks, notebooks, and even the QGIS project in the repository for easy visualization and reproduction.
References and the data:
- China building benchmark by Geoalert 👈
- Zhu, X. X., Chen, S., Zhang, F., Shi, Y., and Wang, Y.: GlobalBuildingAtlas: an open global and complete dataset of building polygons, heights and LoD1 3D models, 2025
- Yinxia Cao, Xin Huang: A deep learning method for building height estimation using high-resolution multi-view imagery over urban areas: A case study of 42 Chinese cities, 2021
- Che, Y., Li, X., Liu, X., Wang, Y., Liao, W., Zheng, X., Zhang, X., Xu, X., Shi, Q., Zhu, J., Zhang, H., Yuan, H., and Dai, Y.: 3D-GloBFP: the first global three-dimensional building footprint dataset, 2024
- Inessa Tregubova, Testing a New Global 3-D Building Footprint Dataset in São Paulo, 2025
- Building height estimation with meta-angles by Geoalert (old but still relevant as a method), 2019
Originally published on Medium