
Updating Telecom Maps with Mapflow: a faster alternative to purchasing new versions from map vendors
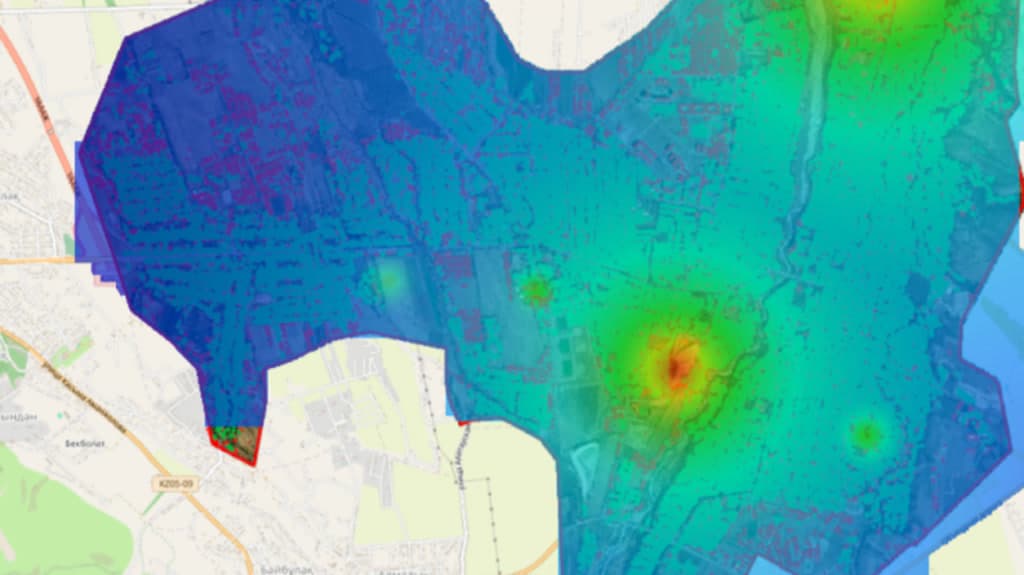
Telecom operators rely on accurate digital maps for radio network planning, coverage prediction, and capacity optimization. But buildings, vegetation, and transport infrastructure change continuously, so telecom maps can become outdated long before their expected lifecycle ends.
The traditional approach is to purchase a completely new telecom dataset from a map vendor. While effective, this can be expensive and time-consuming, especially when only a small part of the territory changed.
Mapflow offers a different approach: update only the features that changed using recent satellite imagery and AI-generated geospatial layers. This enables faster refresh cycles while preserving existing investments in Atoll-compatible datasets.

Why full map update is not always the best option
For national and regional operators, telecom datasets may cover thousands of square kilometers. In most years, only a fraction of that area changes significantly:
- New residential districts are built.
- Industrial zones expand.
- Some roads and vegetation patterns shift locally.
Despite this localized change pattern, operators are often forced to replace the full dataset to get updated information.
With Mapflow, operators can detect differences directly from recent imagery and refresh only affected areas.
Data freshness matters
Accurate representation of buildings and vegetation is critical for radio propagation modeling. In this study, we compared an existing Atoll dataset with layers generated by Mapflow from recent satellite imagery.
For buildings, Mapflow detected 9,982 structures that were absent in the existing dataset. In fast-growing urban and suburban zones, this can materially change clutter heights and propagation calculations.
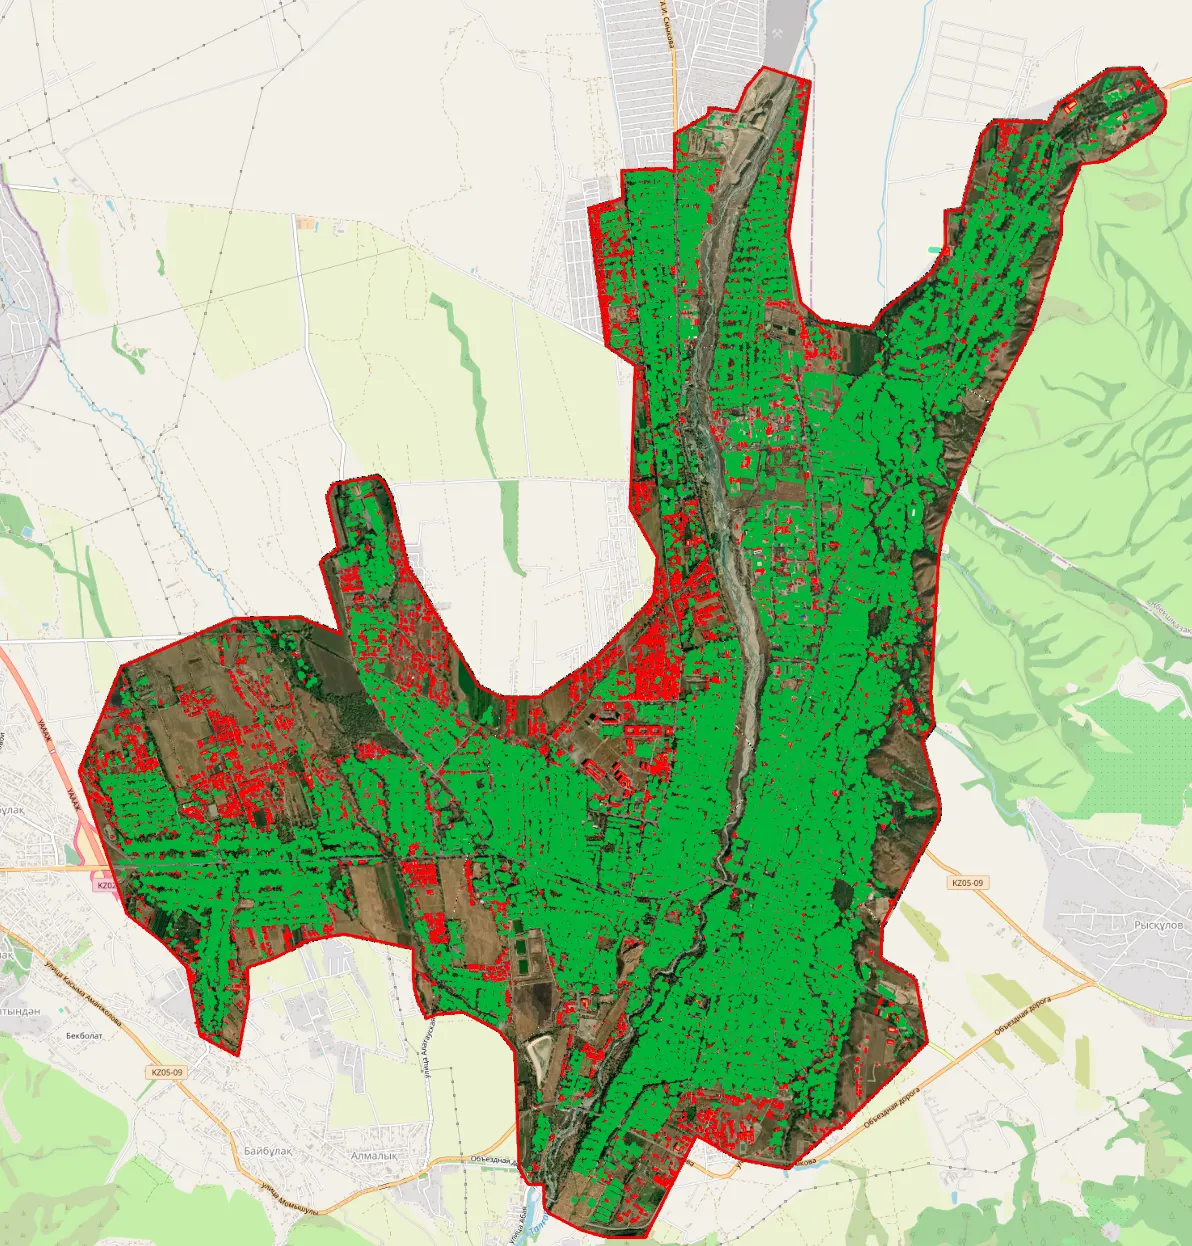 Fig. 1. Red: new buildings detected by Mapflow; green: buildings in the existing Atoll dataset.
Vegetation analysis revealed another important mismatch: the clutter model vegetation did not fully match actual vegetation visible in satellite imagery.
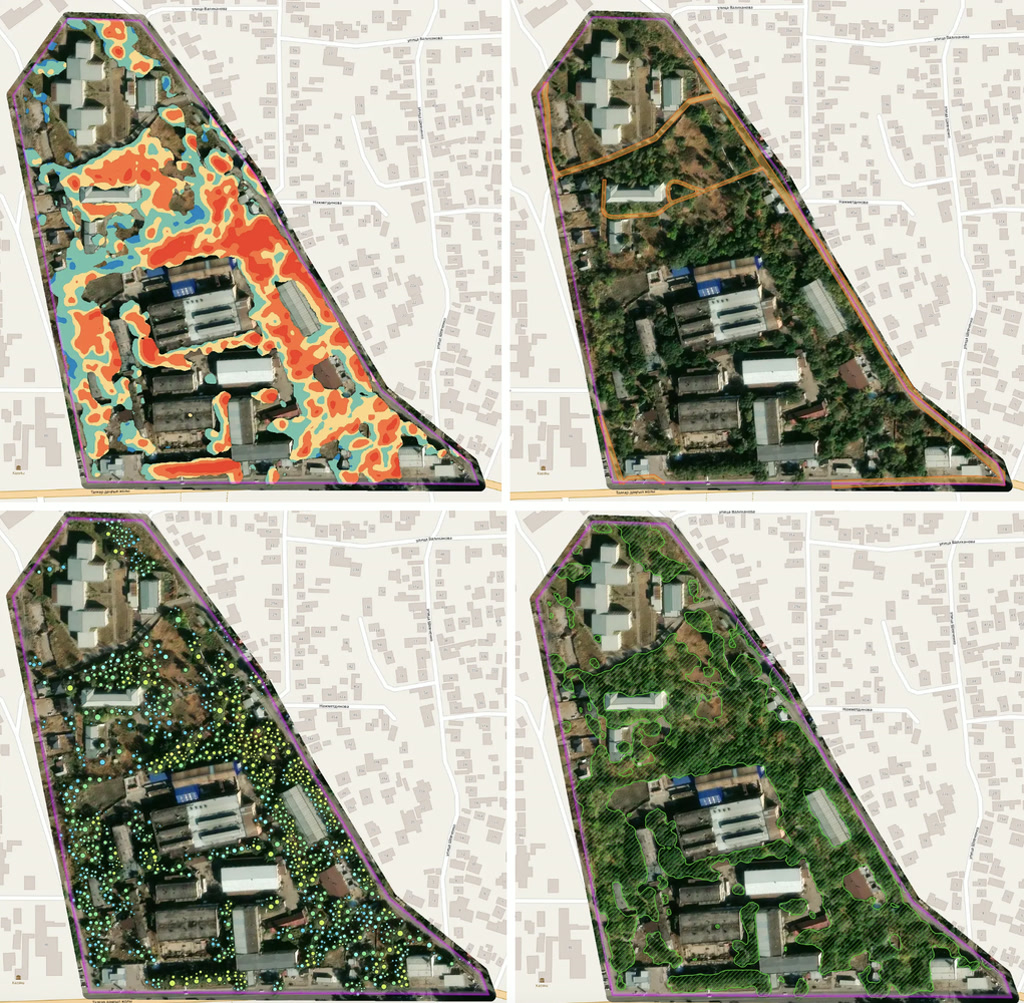 Fig. 2. Existing clutter model versus vegetation with heights extracted by Mapflow.
To validate whether this difference was only temporal, we also compared historical imagery (dataset year) against more recent imagery.
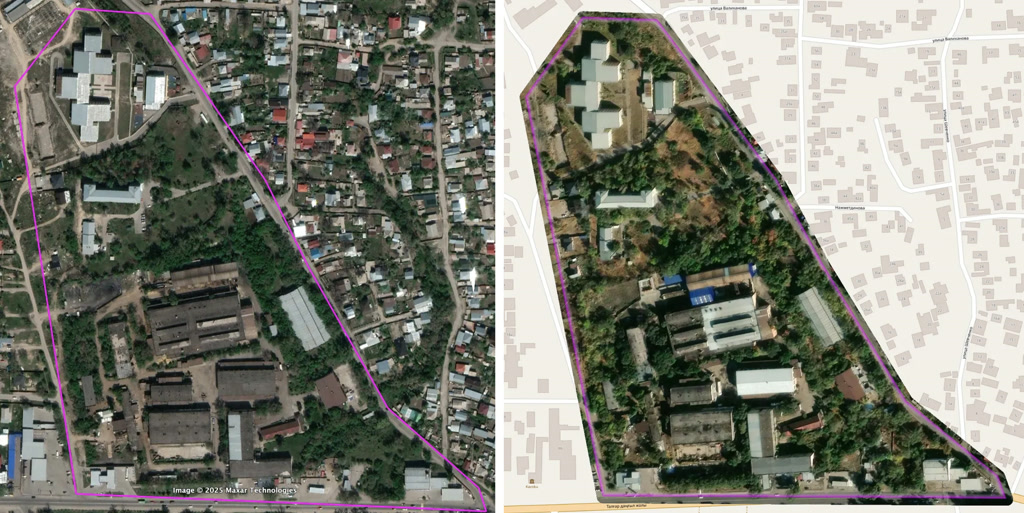 Fig. 3. Satellite imagery from the original dataset period versus recent imagery.
This comparison highlights two practical challenges:
- Physical environments change continuously, so periodic updates are required.
- Legacy clutter models may contain vegetation representation gaps even before temporal change is considered.
Telecom map update workflow
The workflow can be summarized in five steps.
Step 1. Acquire recent satellite imagery
Collect up-to-date satellite imagery for the area of interest.
Step 2. Run AI-based feature extraction in Mapflow
Generate telecom-relevant layers:
- Building footprints with heights
- Vegetation polygons with heights
- Canopy Height Model (CHM)
- Road network
Step 3. Detect changes against the existing dataset
Compare Mapflow outputs with the current telecom map and identify:
- New and removed buildings
- New and modified vegetation
- New roads
This is where the main value is created: teams focus on changed features instead of reproducing the entire map.
Step 4. Convert features into Atoll-compatible layers
Transform detected changes into required telecom formats:
- Clutter height raster
- Vegetation classes
- Road classes
- Clutter model classes
Step 5. Generate updated telecom layers
Merge transformed changes with the existing dataset to produce:
- Updated clutter heights
- Updated clutter model
- Updated building layer
- Updated vegetation layer
- Updated road layer
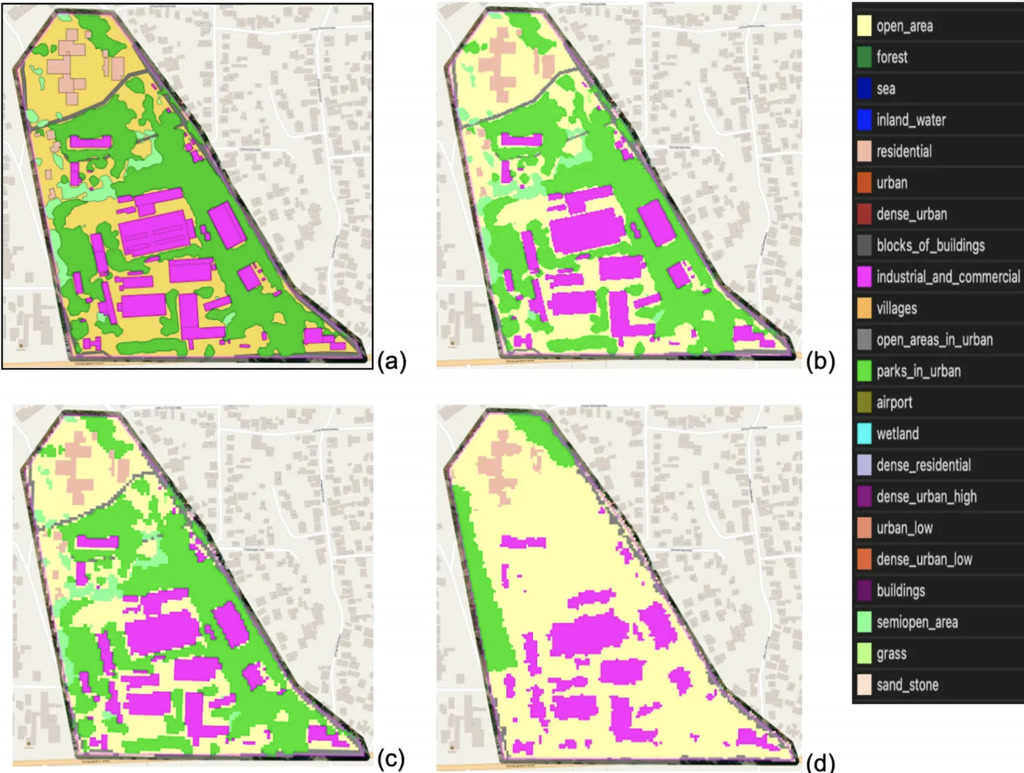 Fig. 5. Example outputs before and after update in the telecom mapping workflow.
Results from Talgar, Kazakhstan
To evaluate the approach, we processed approximately 40 km2 around Talgar.
Buildings
Mapflow detected 9,982 buildings absent from the existing dataset, including:
- 14 buildings lower than 3 m
- 9,727 buildings between 3 and 10 m
- 237 buildings between 10 and 20 m
- 4 buildings between 20 and 40 m
Vegetation
Mapflow vegetation analysis identified:
- 1.35 km2 below 4 m (3% of area)
- 8.86 km2 between 4 and 10 m (22% of area)
- 2.53 km2 above 10 m (6% of area)
These differences show how quickly telecom datasets can drift from on-ground conditions.
Conclusion
Operators do not always need to replace a full telecom mapping dataset to maintain RF planning quality.
By combining recent satellite imagery with Mapflow AI models, operators can update only the features that changed since the last production cycle. This significantly reduces update scope, delivery time, and cost while keeping compatibility with existing Atoll workflows.
The Talgar example demonstrates that targeted, continuous map maintenance can uncover thousands of missing buildings and major vegetation changes, making this approach a practical alternative to periodic (1-3 years) maps vendor's supplies.
References
Originally published on Medium