
Buildings model update — starting global benchmarks

We released the 2026 update of the Global Buildings model. This is a significant milestone for our R&D team. There are two main reasons that make us happy: first, this is our own and most demanded model in Mapflow and, second, it's aimed to work globally.
If you have been following the Mapflow R&D blog, you may have noticed that we often discuss foundational models in the context of their application to geospatial data and imagery, and whether they are ready to conquer the world under the broad umbrella of Geospatial AI promoted by companies like ESRI. The long story short, the foundational models are not that stable so far to be used in freemium services like our platform (Mapflow AI), not to say they are computationally demanding. That said, we care about the global climate impact of the data centers, and we target specific models outperforming "GeoAI" by putting all this research effort into the Mapflow models.

Indeed, in 2026, the 🏠 Buildings model was used in around 65% of all Mapflow processings. And in 60% of these cases, users also enabled the Height estimation option. The model is also a part of our multi-model workflows, together with Forest and Roads, aimed at producing land-use-style maps.
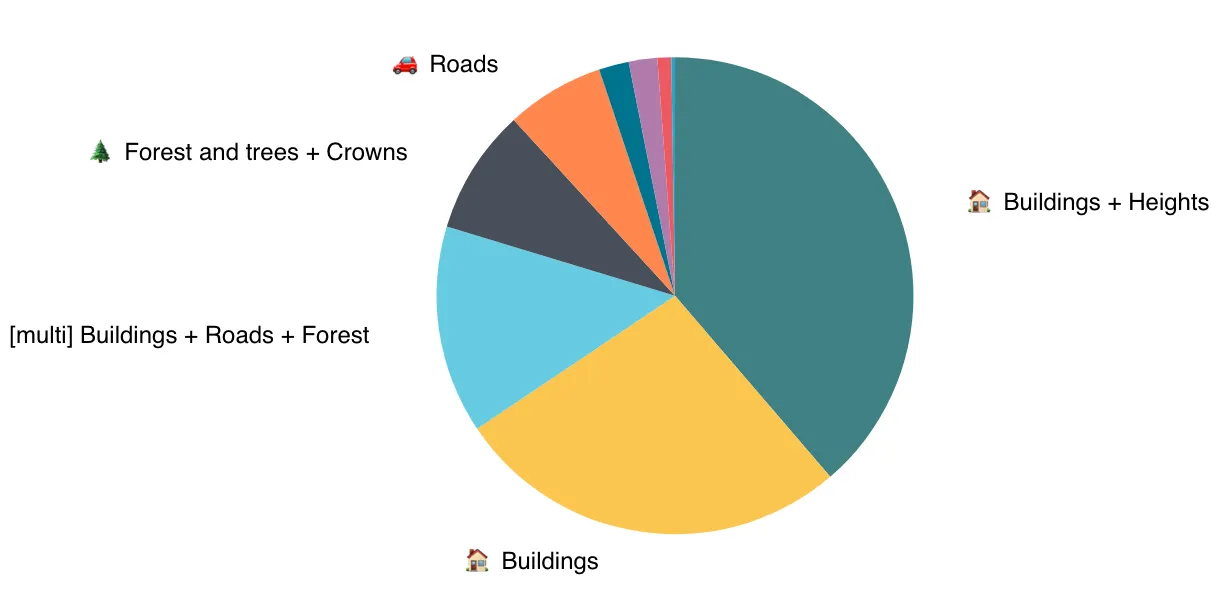 The share of 🏠 Buildings model usage across users' workflows in 2026
As you can see, this model's performance is essential for Mapflow users, and the analysis of the model's drawbacks depends on its validation on a distributed set of samples. This set is partially collected based on Mapflow users' feedback — we aimed at collecting samples where the previous model appeared to perform not good enough.
Global Building benchmarks
With this release, we also start publishing our global benchmarks to make the evaluation process more transparent.
The benchmarks are manually drawn building labels, cross-validated to reduce human errors. Some of these samples were collected from areas where previous model versions were less stable, including regions with complex and diverse urban morphology.
BTW, while working on model stability, we also started exploring the topic of urban morphology patterns to build a more diverse and geographically distributed testing dataset. This field itself heavily relies on remote sensing technologies, and we are interested in using scientifically recognized classification approaches to describe model performance in the context of different urban patterns.
So far, it seems there is no single universal classification of urban morphology patterns, but recent research shows growing interest in introducing more systematic approaches to this topic.
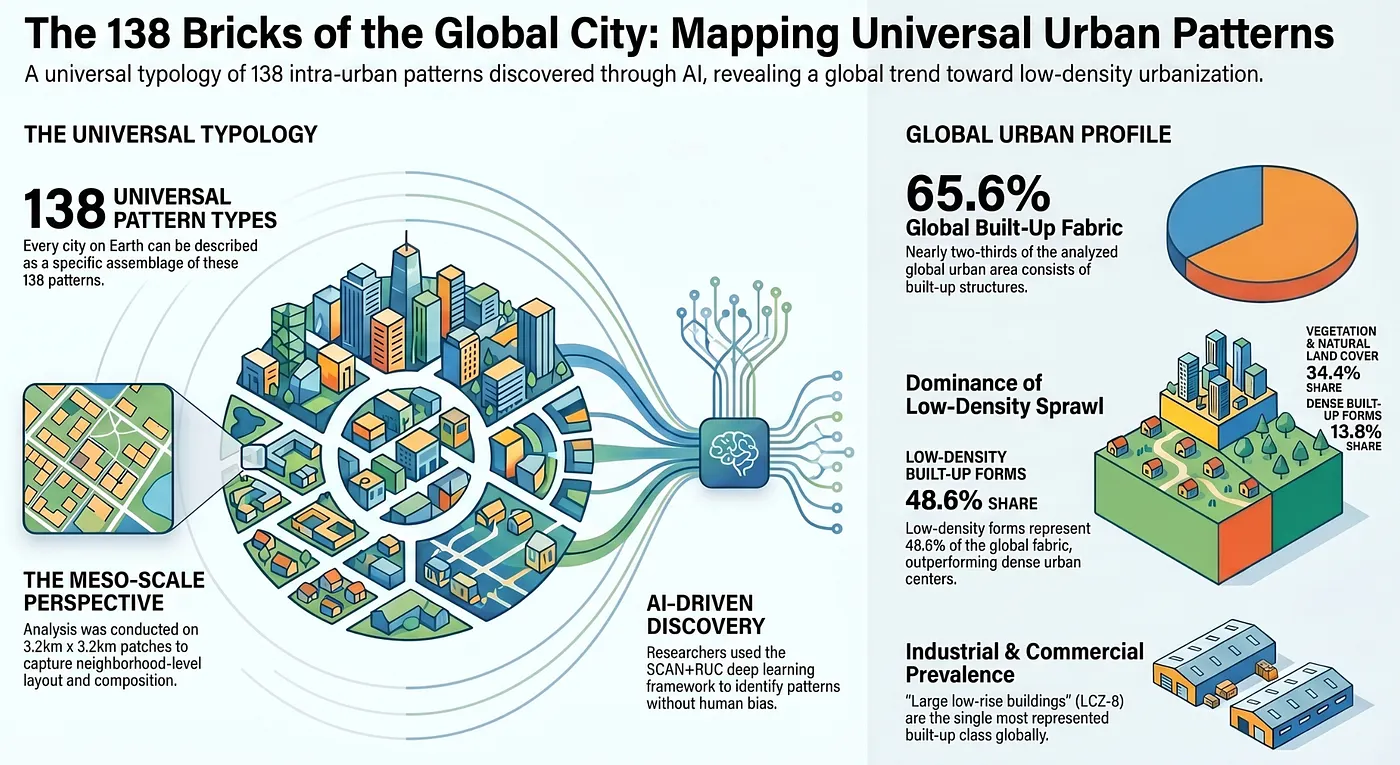 The infographic based on "urban morphology" patterns research
The benchmarks are produced through routine labeling: cartographers manually draw buildings, and the labels then go through cross-validation to minimize human errors. During training, the model is tested against these benchmarks. For this release, we are presenting only part of them, but we decided to start making the data publicly available for those who may be interested in external evaluation.
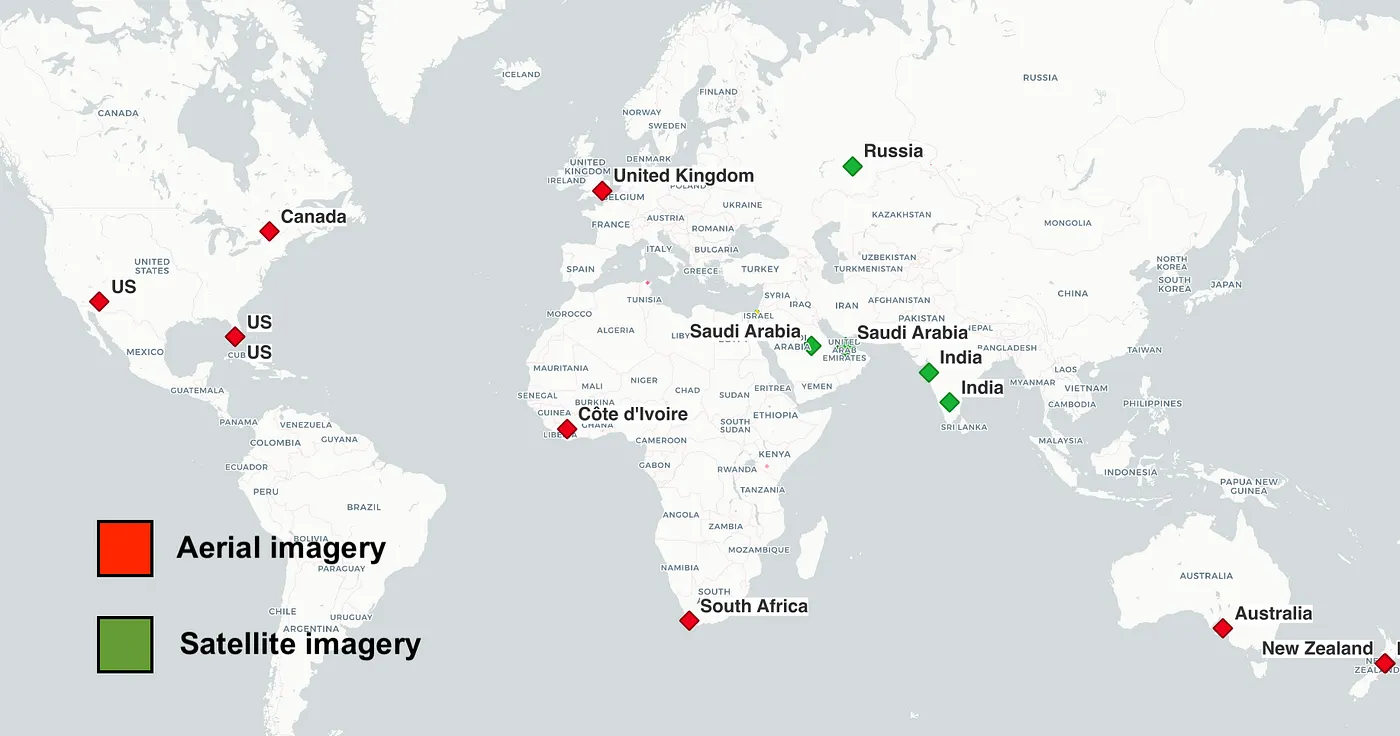 Public benchmarks distribution (Part 1. To be updated)
View the benchmark report in our public documentation.
Results
🏠 Buildings v.2026–07–06 was evaluated on a global validation set of aerial images over 7 areas of interest (AOI) and on satellite imagery across 5 dense urban AOIs. Metrics are area-based: IoU is the intersection-over-union of the predicted and ground-truth building masks, and F1 / Precision / Recall are computed on the overlapping mask area.
So far v.2026–07–06 leads the previous 🏠 Buildings 2025–12–10 model on F1 in all 14 AOIs. On the global validation set of aerial imagery (9 AOIs) the mean area-based F1 rises from 0.849 to 0.893 (IoU 0.751 → 0.813); on the 5 dense-urban satellite imagery AOIs the mean F1 rises from 0.842 to 0.881 (IoU 0.729 → 0.787), driven mainly by higher recall and precision in informal and high-density built-up areas such as Riyadh, Bangalore and Thane.
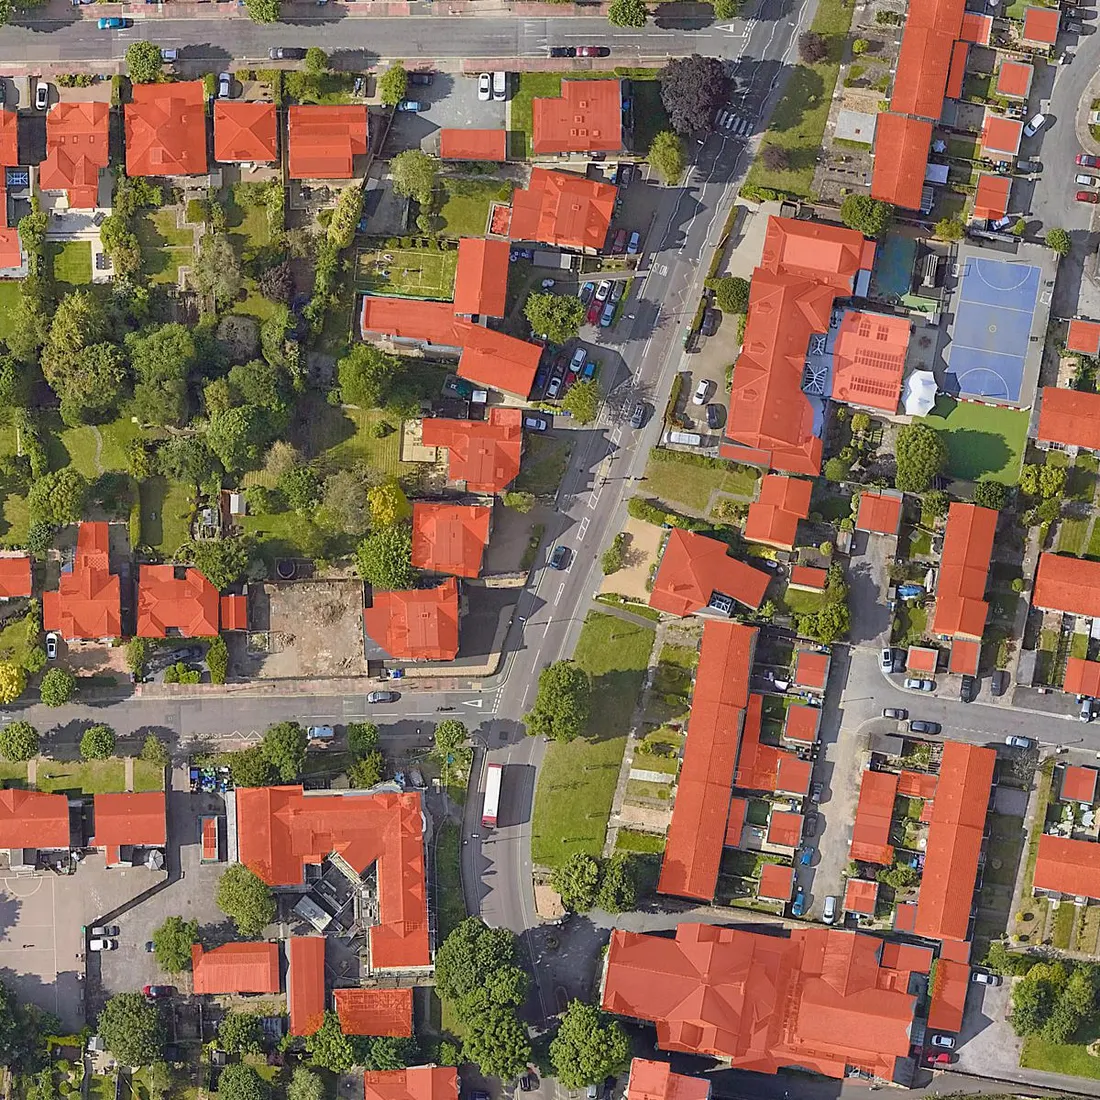
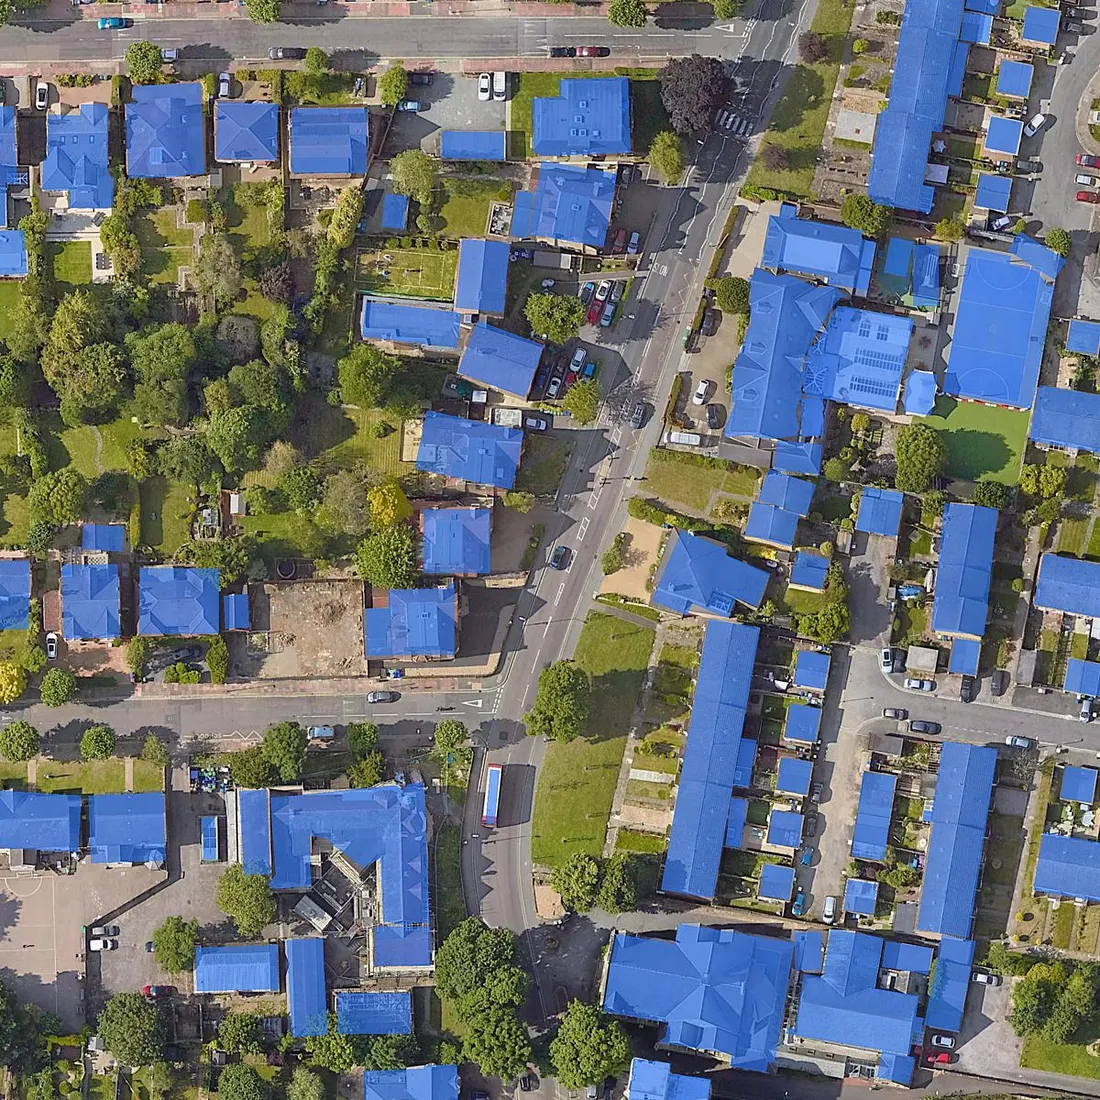 v.2026–07–06 (red) VS v.2025–12–10 (blue), United Kingdom — London. Aerial img.
To put it simply:
- The new version produces more detailed building outlines, which is clearly visible in aerial imagery mapping samples.
- It became more stable across global urban patterns, including challenging areas where the previous model was less consistent. This improvement comes from enlarged training data and more diverse benchmarks.
Workflow updates
We have also updated the 🏠 Buildings post-processing in Mapflow: simplification of building polygons is now always applied by default.
The updated method keeps the result closer to the original pixel mask and reduces annoying issues from previous methods, such as jagged edges and spikes.
The updated simplification is based on a new method that predicts building edge corner points and uses them as polygon vertices while vectorizing the mask. Unlike traditional GIS methods, which are applied after the building mask has already been vectorized, our new method works directly on the image. As a result, the vectorization step receives a mask that is already prepared for polygonization.
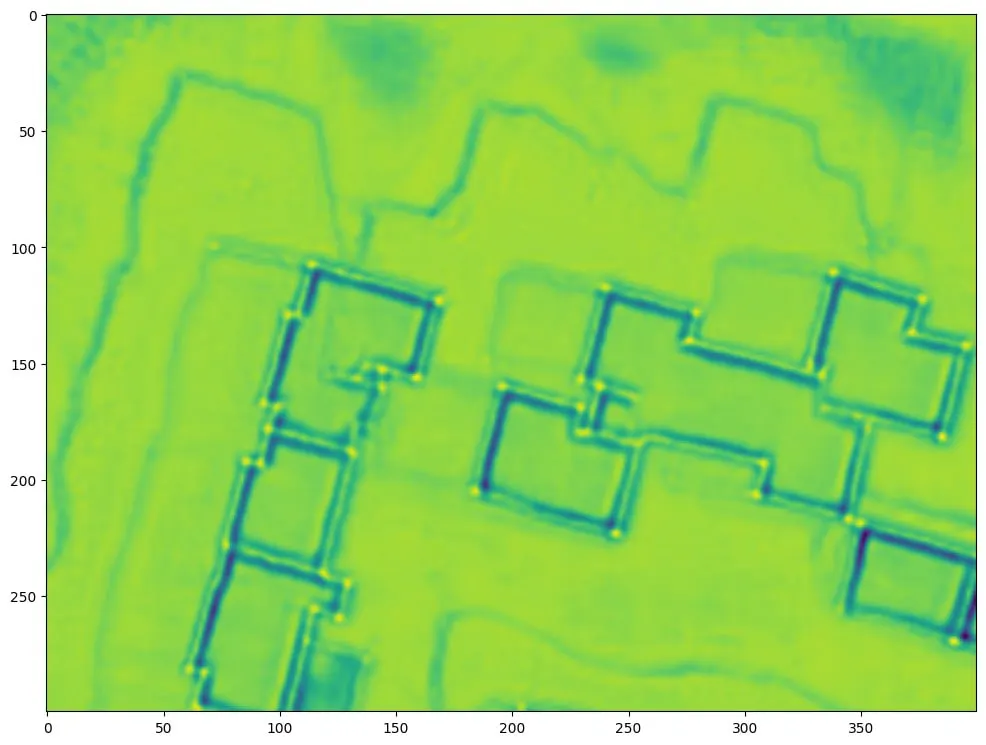 Using the image bands to predict building edge corner points
Future plans
Add more benchmarks, including the Ground Truth labels, to the documentation. This will help us showcase and reference our practical evaluation approach. Researchers are welcome to use these benchmarks to test their own models, including "GeoAI".
In addition to building segmentation, we will publish benchmarks for building height estimation. We have already started this process by publishing a selected portion of benchmarks for China and comparing our model with the Global Building Atlas open dataset.
Stay tuned.
As always, we ask you to share your feedback. We review all ratings and try to follow up whenever we can help.
References
Originally published on Medium